Status Checks
Overview
A Status Check is a step of a Scenario that evaluates the health of your environment. Status Checks hit an endpoint URL to evaluate the status code, the request response time including the JSON response body, and will pass or fail based on your defined criteria. The endpoint can be from a 3rd party tool such as Datadog, New Relic, PagerDuty or your preferred monitoring tool. It could also be a publicly accessible endpoint for your services's health with or without authentication. If the Status Check fails, the Scenario will automatically halt and will record results from the run.
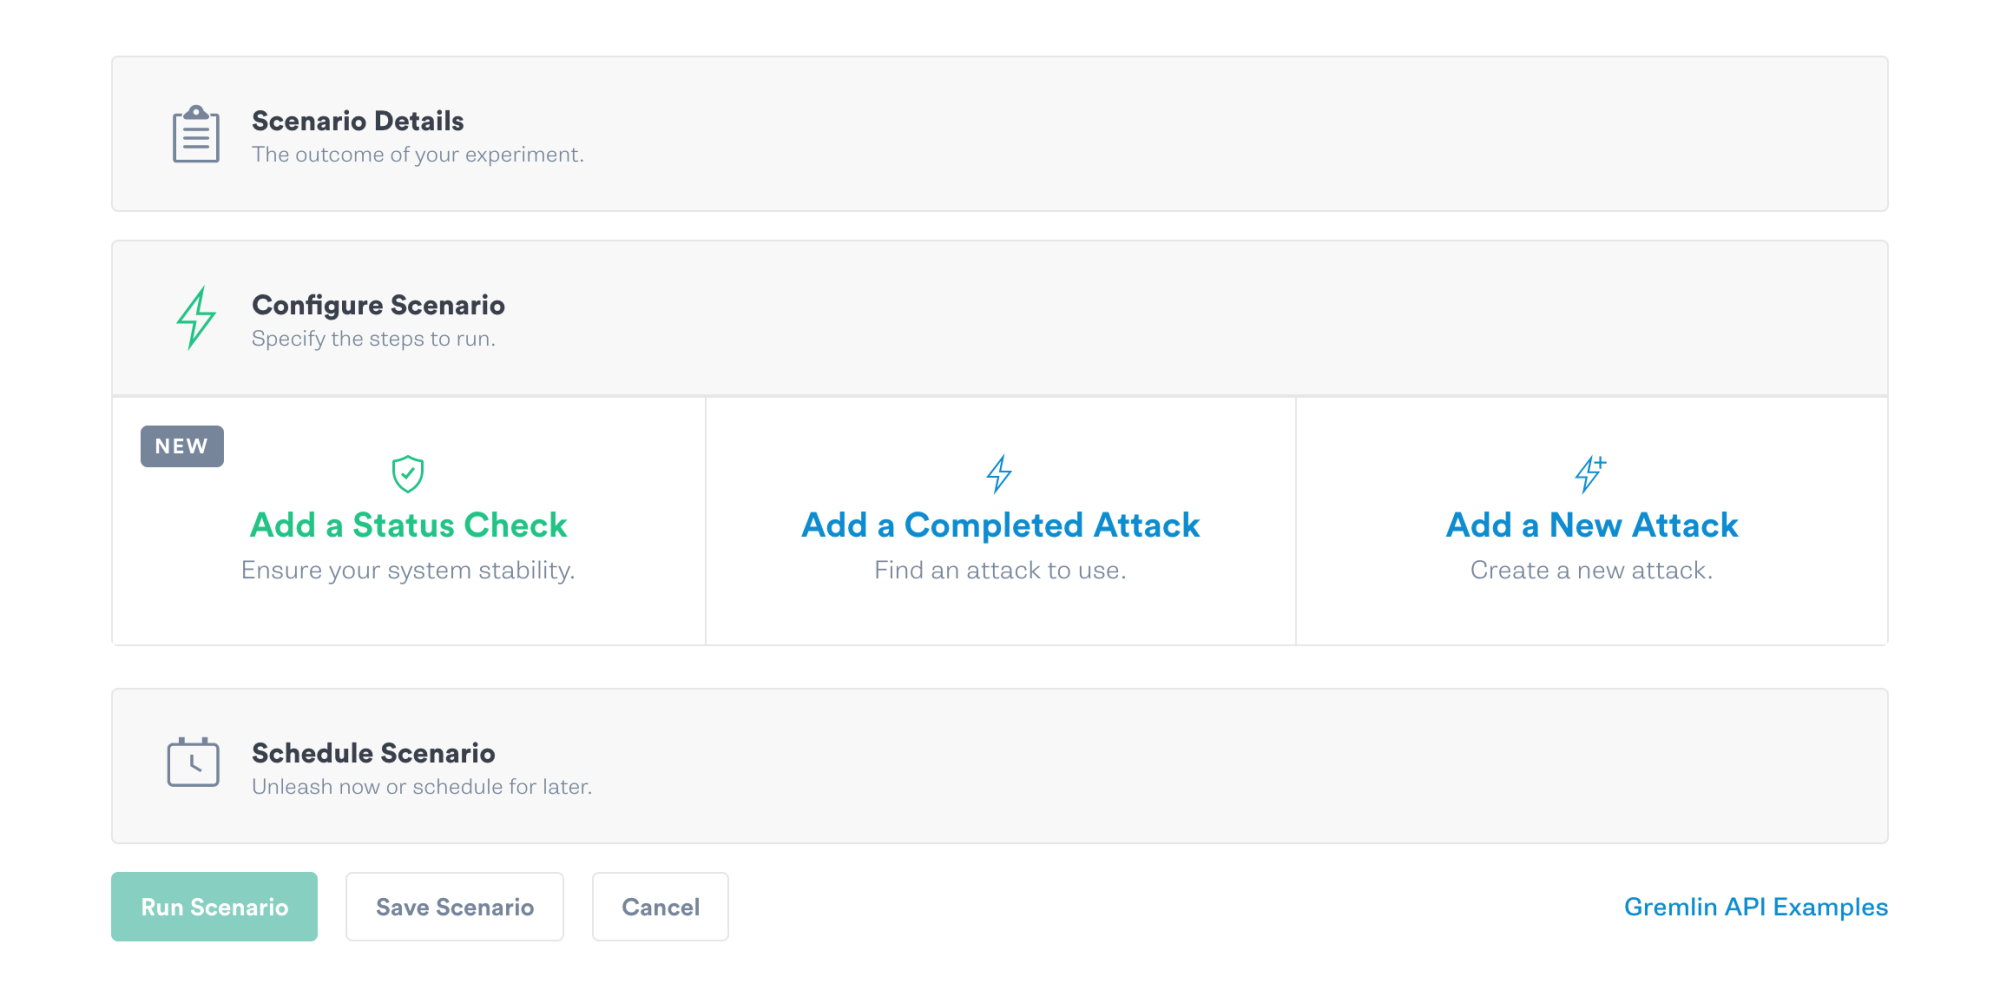
Automate your chaos experiments with Status Checks through a Scenario knowing the attacks will be safely halted if your system doesn’t meet your expected conditions.
Creating a Status Check
A Status Check can be created within the Scenario workflow or in the Status Check library.
Configuration
Saving a Status Check in your Team's library allows you to reuse Status Checks in a Scenario or start with a template to customize. A saved Status Check will store the Configuration and Success Evaluation including Header information.
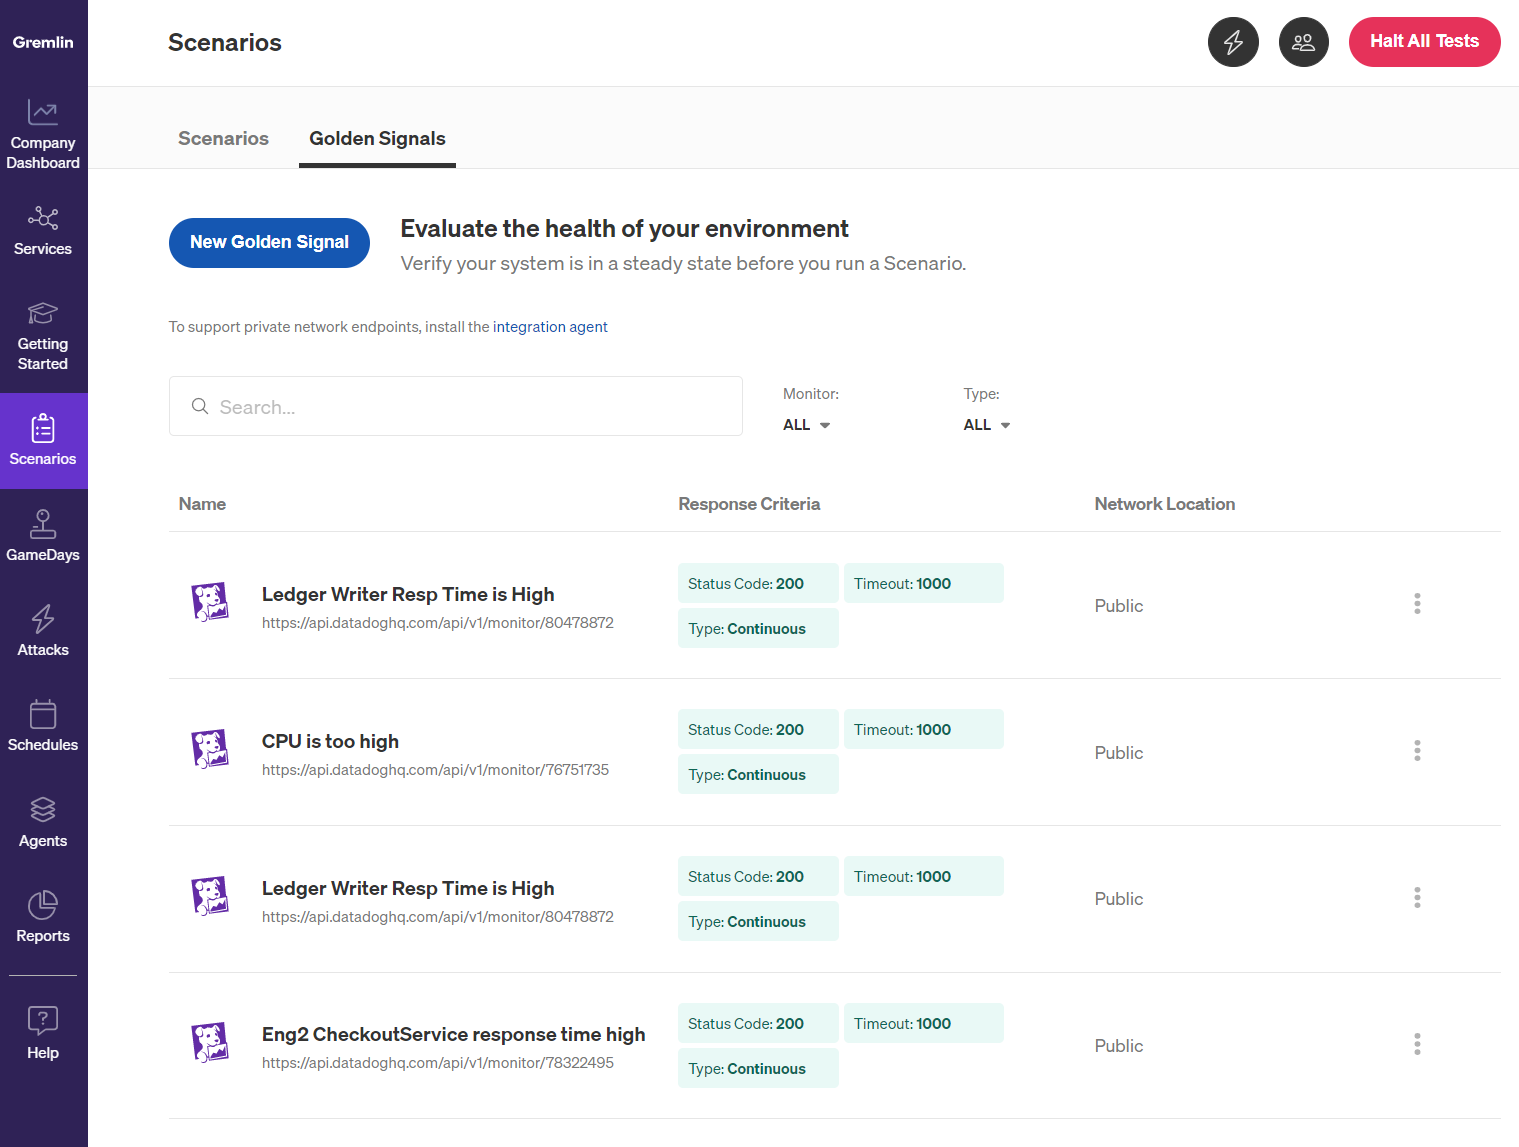
In the Status Checks library select the "New Status Check" button to bring up the creation form. Follow the steps below to configure and save your Status Check. This Status Check will be available for your entire team to import into the Scenario workflow.
You can duplicate or delete a Status Check within the overflow menu of each saved Status Check. Duplicating allows for ease of creating multiple Status Checks with different Success Evaluation parameters. Deleting a Status Check will permanently remove it from the library but each Scenario that is using it will get a copy of the configuration and not be impacted.
Continuous Status Check
Use the toggle button to allow the Status Check to run continuously during the Scenario (polling every 10 seconds). A Continuous Status Check evaluates the success criteria to help validate how your system handles the failure injected during the attack. If the evaluation fails the Scenario will halt and record the last response result and Scenario step that was interrupted.

Name, Description, Endpoint URL
Create a Status Check by entering a name, description, and endpoint URL. For a description, it’s helpful to include what services you're testing or what you’re expecting to happen. The endpoint URL is the endpoint that the Status Check will hit and whose response will get evaluated in order to determine success or failure of the Scenario. Use the drop down menu on the Status Check form to select Datadog, New Relic, or PagerDuty to pre-populate the form to easily start a Status Check or use the Custom option to build your own.

Header Information
Add the headers needed to authenticate the request, specific to the 3rd party the Status Check is communicating with. For example, to add a Status Check for a DataDog endpoint, you will need two headers
- Your organization’s API key
- Your application key
For more information on authentication, please see information specific to DataDog, New Relic, PagerDuty, or the third-party monitoring solution that is used on your system.
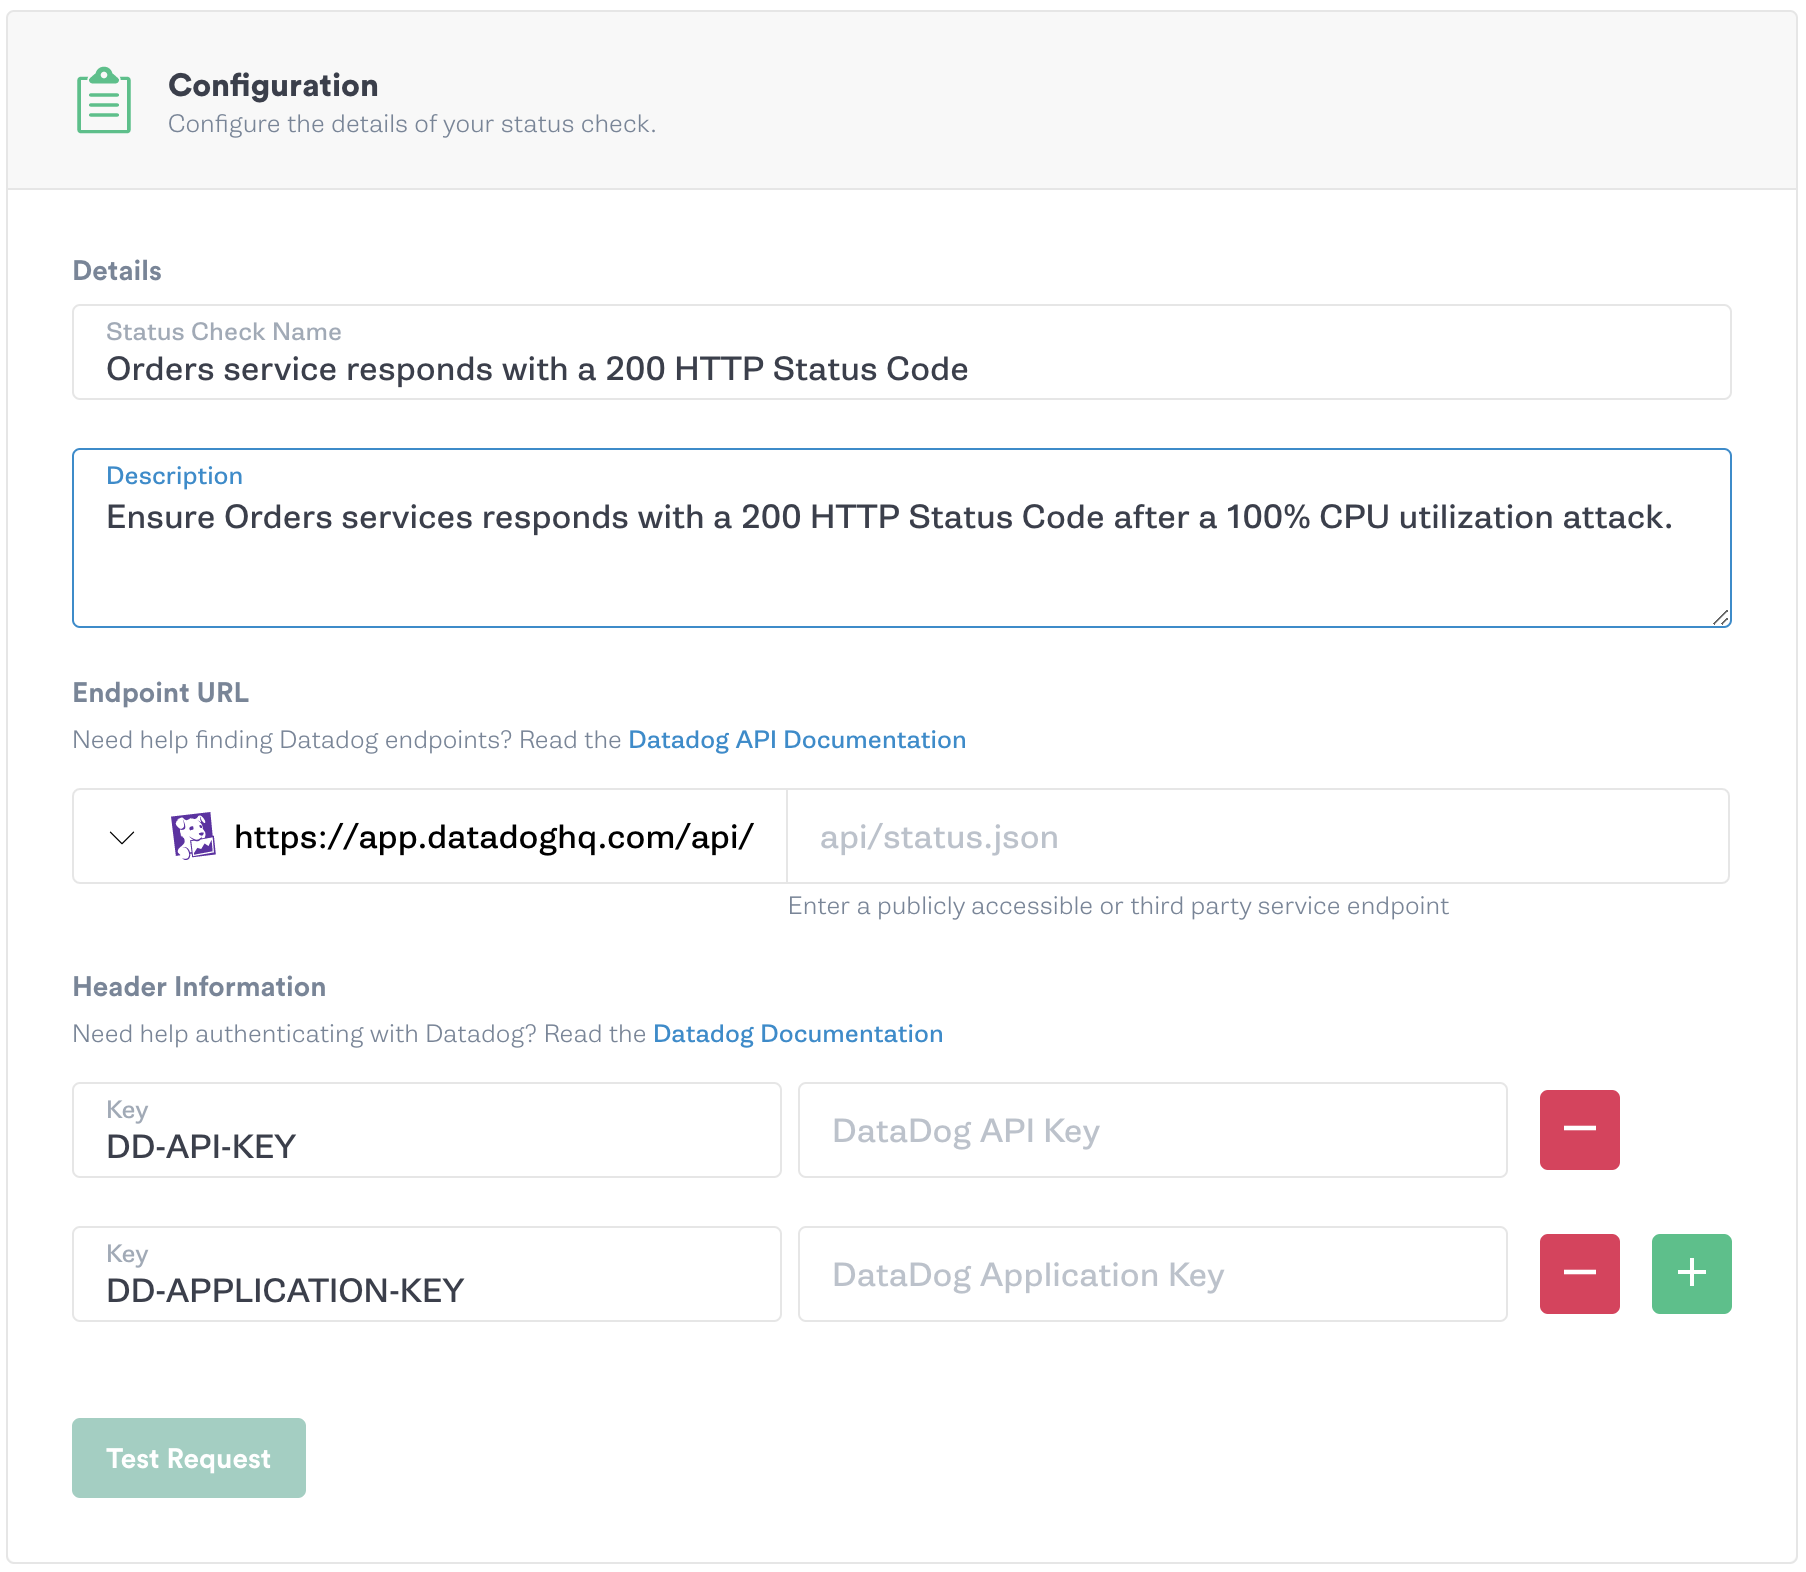
Once you have added the above fields, use the “Test Request” button to ensure you have successfully authenticated your request. A successful response will include a 200-204 OK HTTP status code, the time it took to respond, and the Request Response Body. An unsuccessful or unauthorized response will respond with a 4XX or 5XX status code.
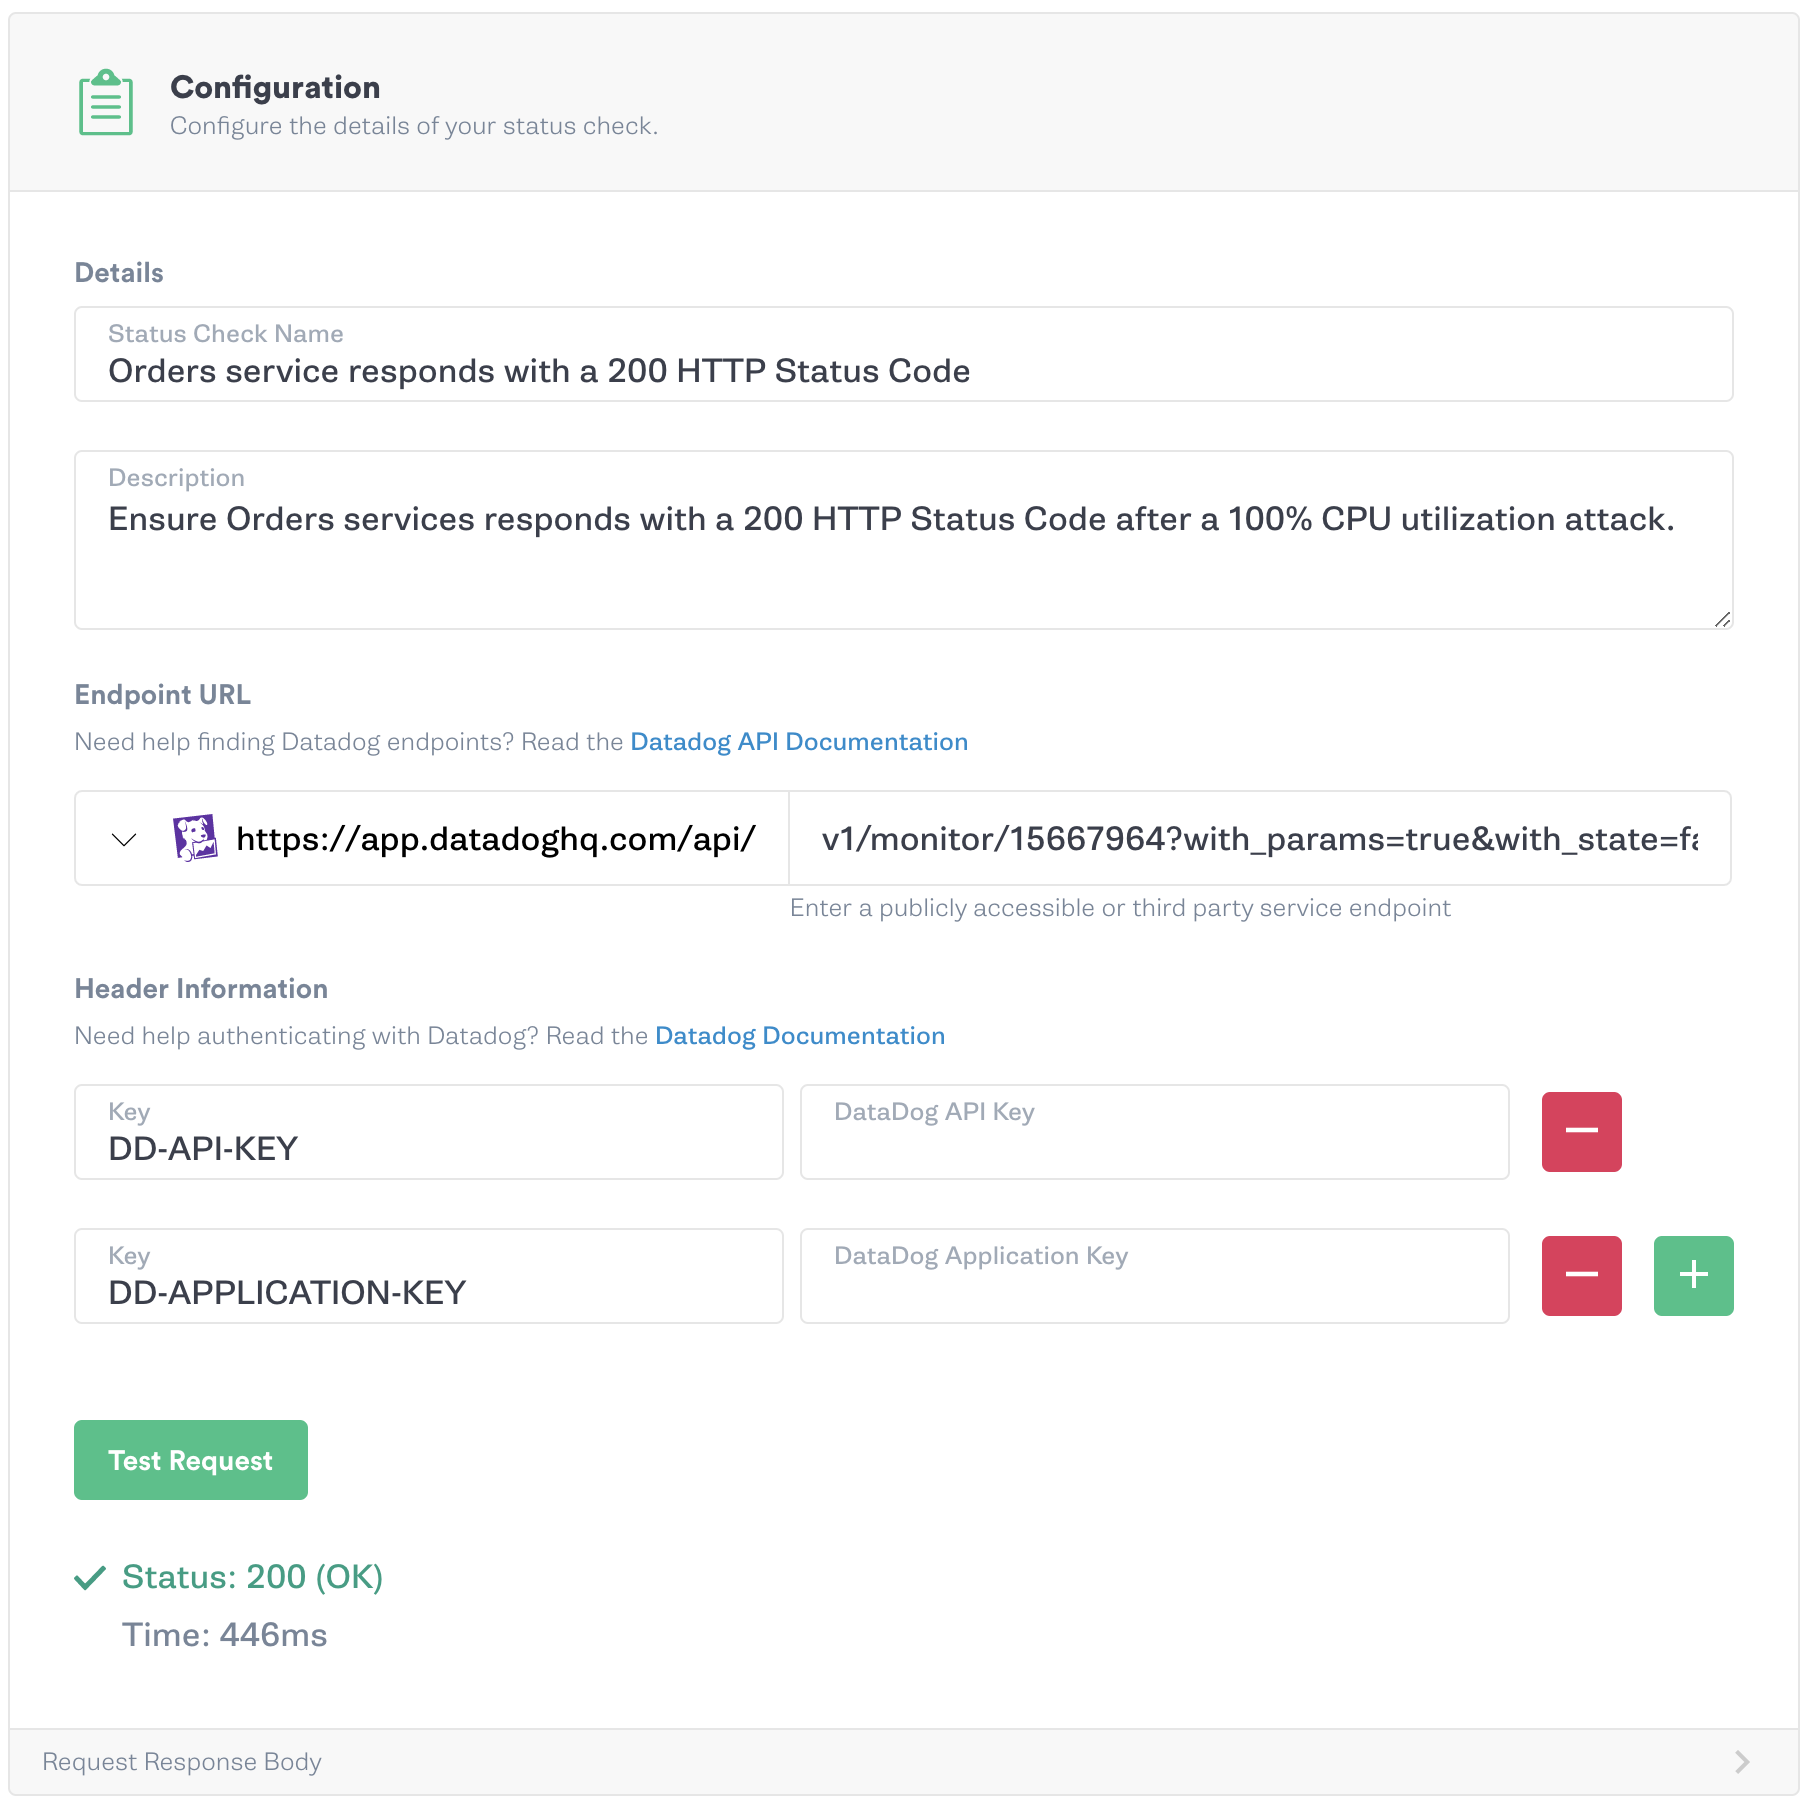
Header content information can also be added to evaluate content type or specify an API version in the endpoint URL.
Success Evaluation
Provide success criteria that your Status Check will evaluate the response against to keep the Scenario running.
Healthy Status Code
Add the status code the response should include if the service is healthy. If the status code responds outside of this code or range of codes then the Scenario will automatically halt. See the list of HTTP Status Codes for more guidance. Besides a single HTTP Status Code, you can also enter in a range such as 200-204.
Request Timeout
For the Request Timeout, add the maximum time in milliseconds to wait for a response before halting the Scenario. For example, you might add a Status Check before starting a latency attack to validate your service is responding within your Service Level Indicator (SLI) and Service Level Objectives (SLO) requirements. This would ensure that a Scenario halts prior to introducing even more latency on your service.
Healthy response body criteria
Add the key that you expect from the response body, and then add a comparator to ensure the value associated with that key is accurate. If the value doesn’t pass the comparator you add, the Scenario will halt. This field is especially important for evaluating the responses from 3rd party monitoring software. At this time, we support JSON response bodies. This was implemented using the Jayway JsonPath library. Please refer to their docs for options for evaluating response body criteria as well as the basic Operators and Functions tables below.
Operators
| Operator | Description |
|---|---|
$ | The root element to query. This starts all path expressions. |
@ | The current node being processed by a filter predicate. |
* | Wildcard. Available anywhere a name or numeric are required. |
.. | Deep scan. Available anywhere a name is required. |
.<name> | Dot-notated child |
['<name>' (, '<name>')] | Bracket-notated child or children |
[<number> (, <number>)] | Array index or indexes |
[start:end] | Array slice operator |
[?(<expression>)] | Filter expression. Expression must evaluate to a boolean value. |
Tables are from the Jayway JSONpath library
Functions
Functions can be invoked at the tail end of a path - the input to a function is the output of the path expression. The function output is dictated by the function itself.
| Function | Description | Output |
|---|---|---|
min() | Provides the min value of an array of numbers | Double |
max() | Provides the max value of an array of numbers | Double |
avg() | Provides the average value of an array of numbers | Double |
stddev() | Provides the standard deviation value of an array of numbers | Double |
length() | Provides the length of an array | Integer |
sum() | Provides the sum value of an array of numbers | Double |
Tables are from the Jayway JSONpath library
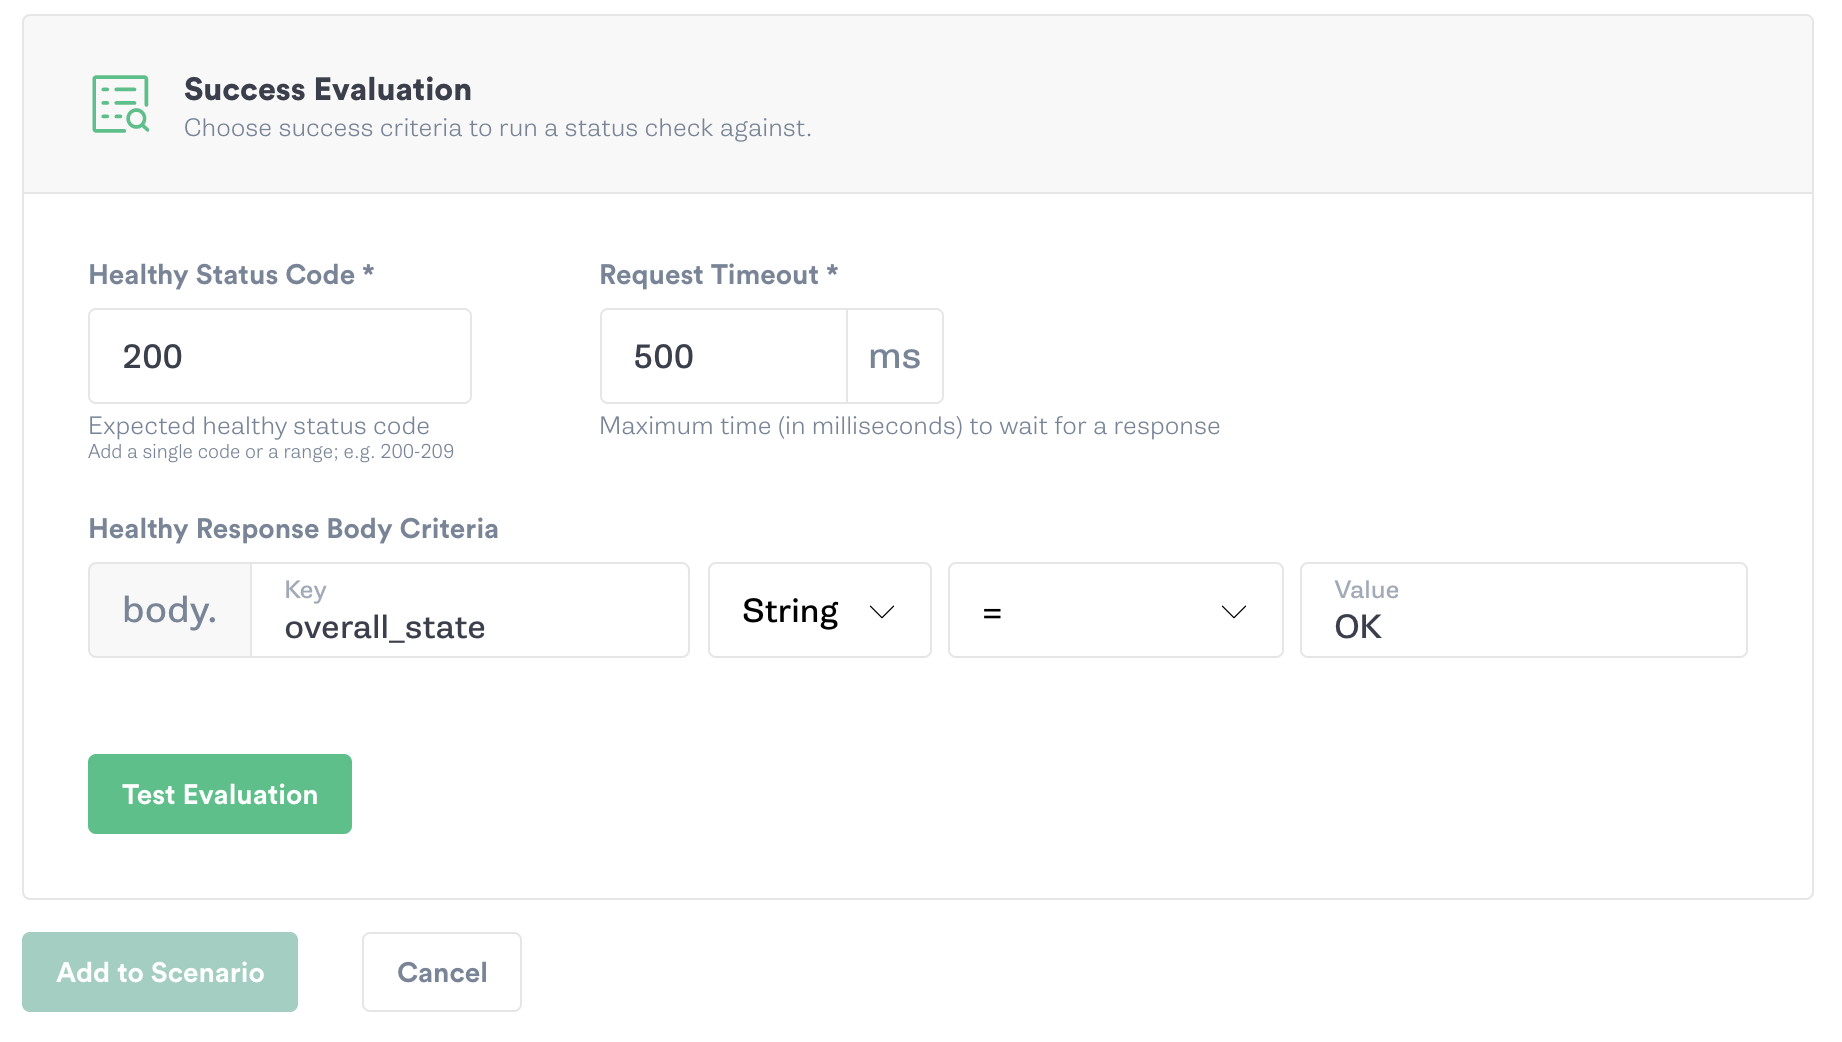
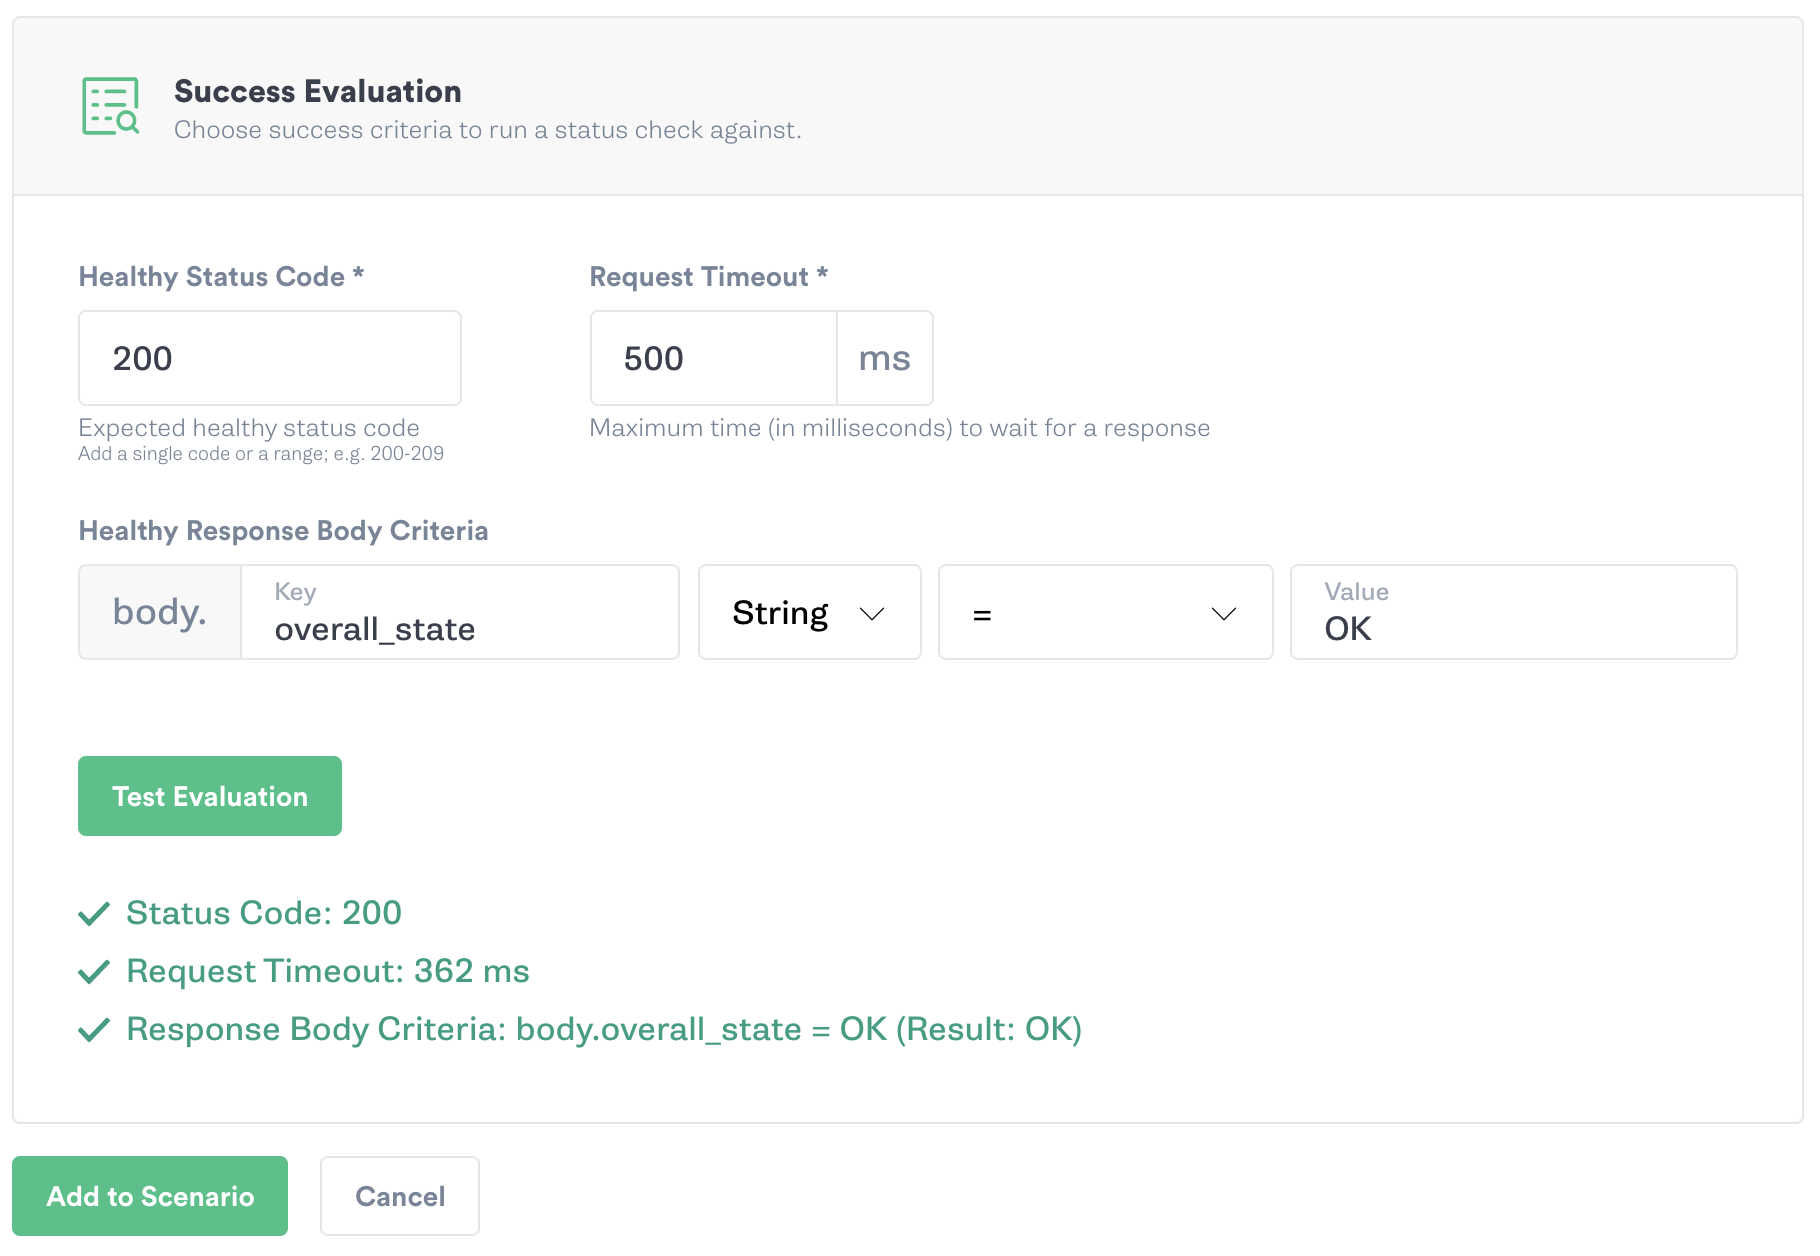
Once you’ve added the above fields, use the “Test Evaluation” button to ensure that you’ve successfully set up the Status Check criteria. A successful response will confirm your success criteria and enable the “Add to Scenario” button. If your endpoint URL responds with failed criteria you will still be able to add the Status Check to the scenario since your service could be unhealthy at that point in time.
Running a Scenario with a Status Check
Use the drop down menu to import a Status Check from the Status Check library within the Scenario creation workflow. Importing a Status Check into your Scenario creates a reference to the Status Check in the library. This allows you to make updates to the Status Check in the library and have it populate to Scenarios that use it.

You can also use the imported Status Check as a template and hit the "Customize" button. This creates a copy of the imported Status Check and allows you to make changes to the configuration. Changes won't impact the Status Check in the library.
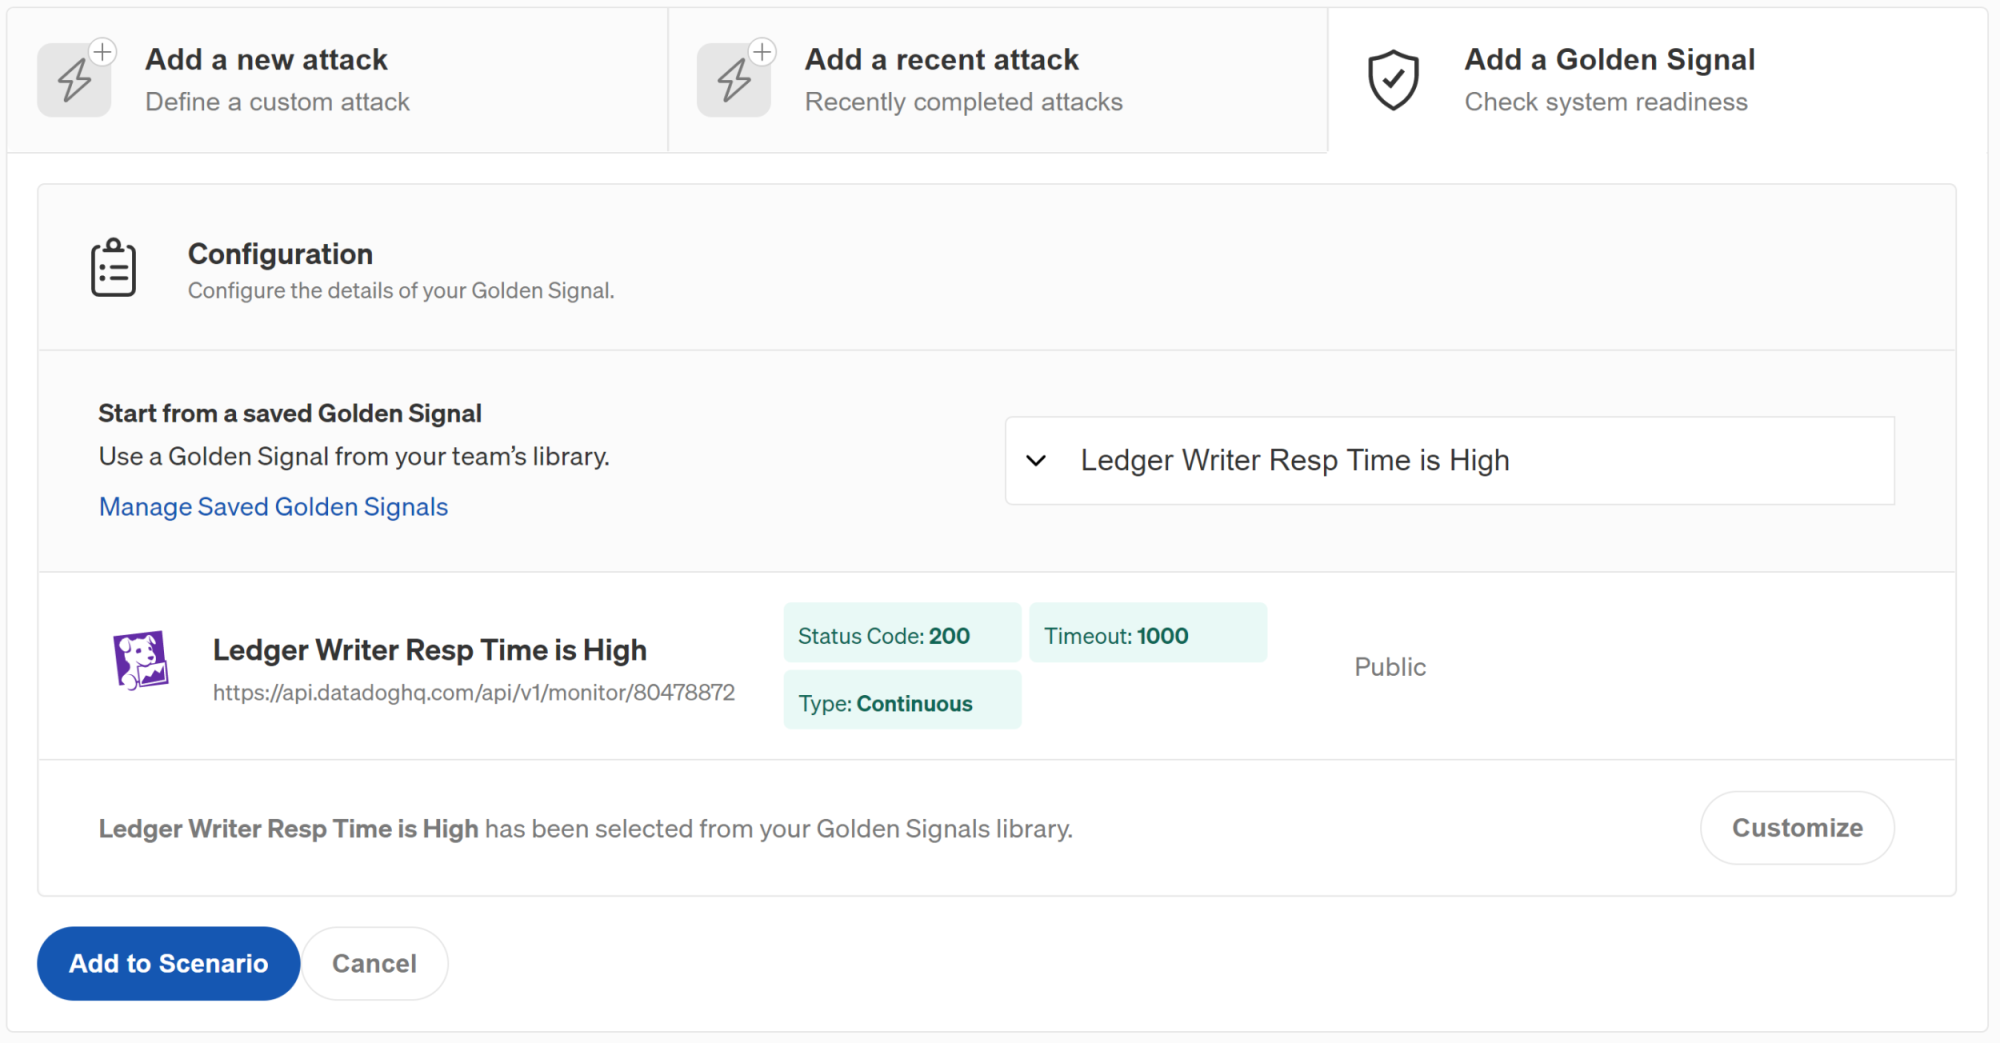
Once you’ve added a Status Check to a Scenario you can add attacks and more Status Checks as needed. The best practice is to add a Status Check before each attack to validate your service is in a healthy state before introducing failure. In some cases you might want to add a Status Check at the end of the Scenario to validate your service returned to its steady state. Use the Continuous Status Check option for Status Checks that you want evaluated throughout the duration of the Scenario. You can follow the instructions in the Scenario document for Running a Scenario.

Notifications
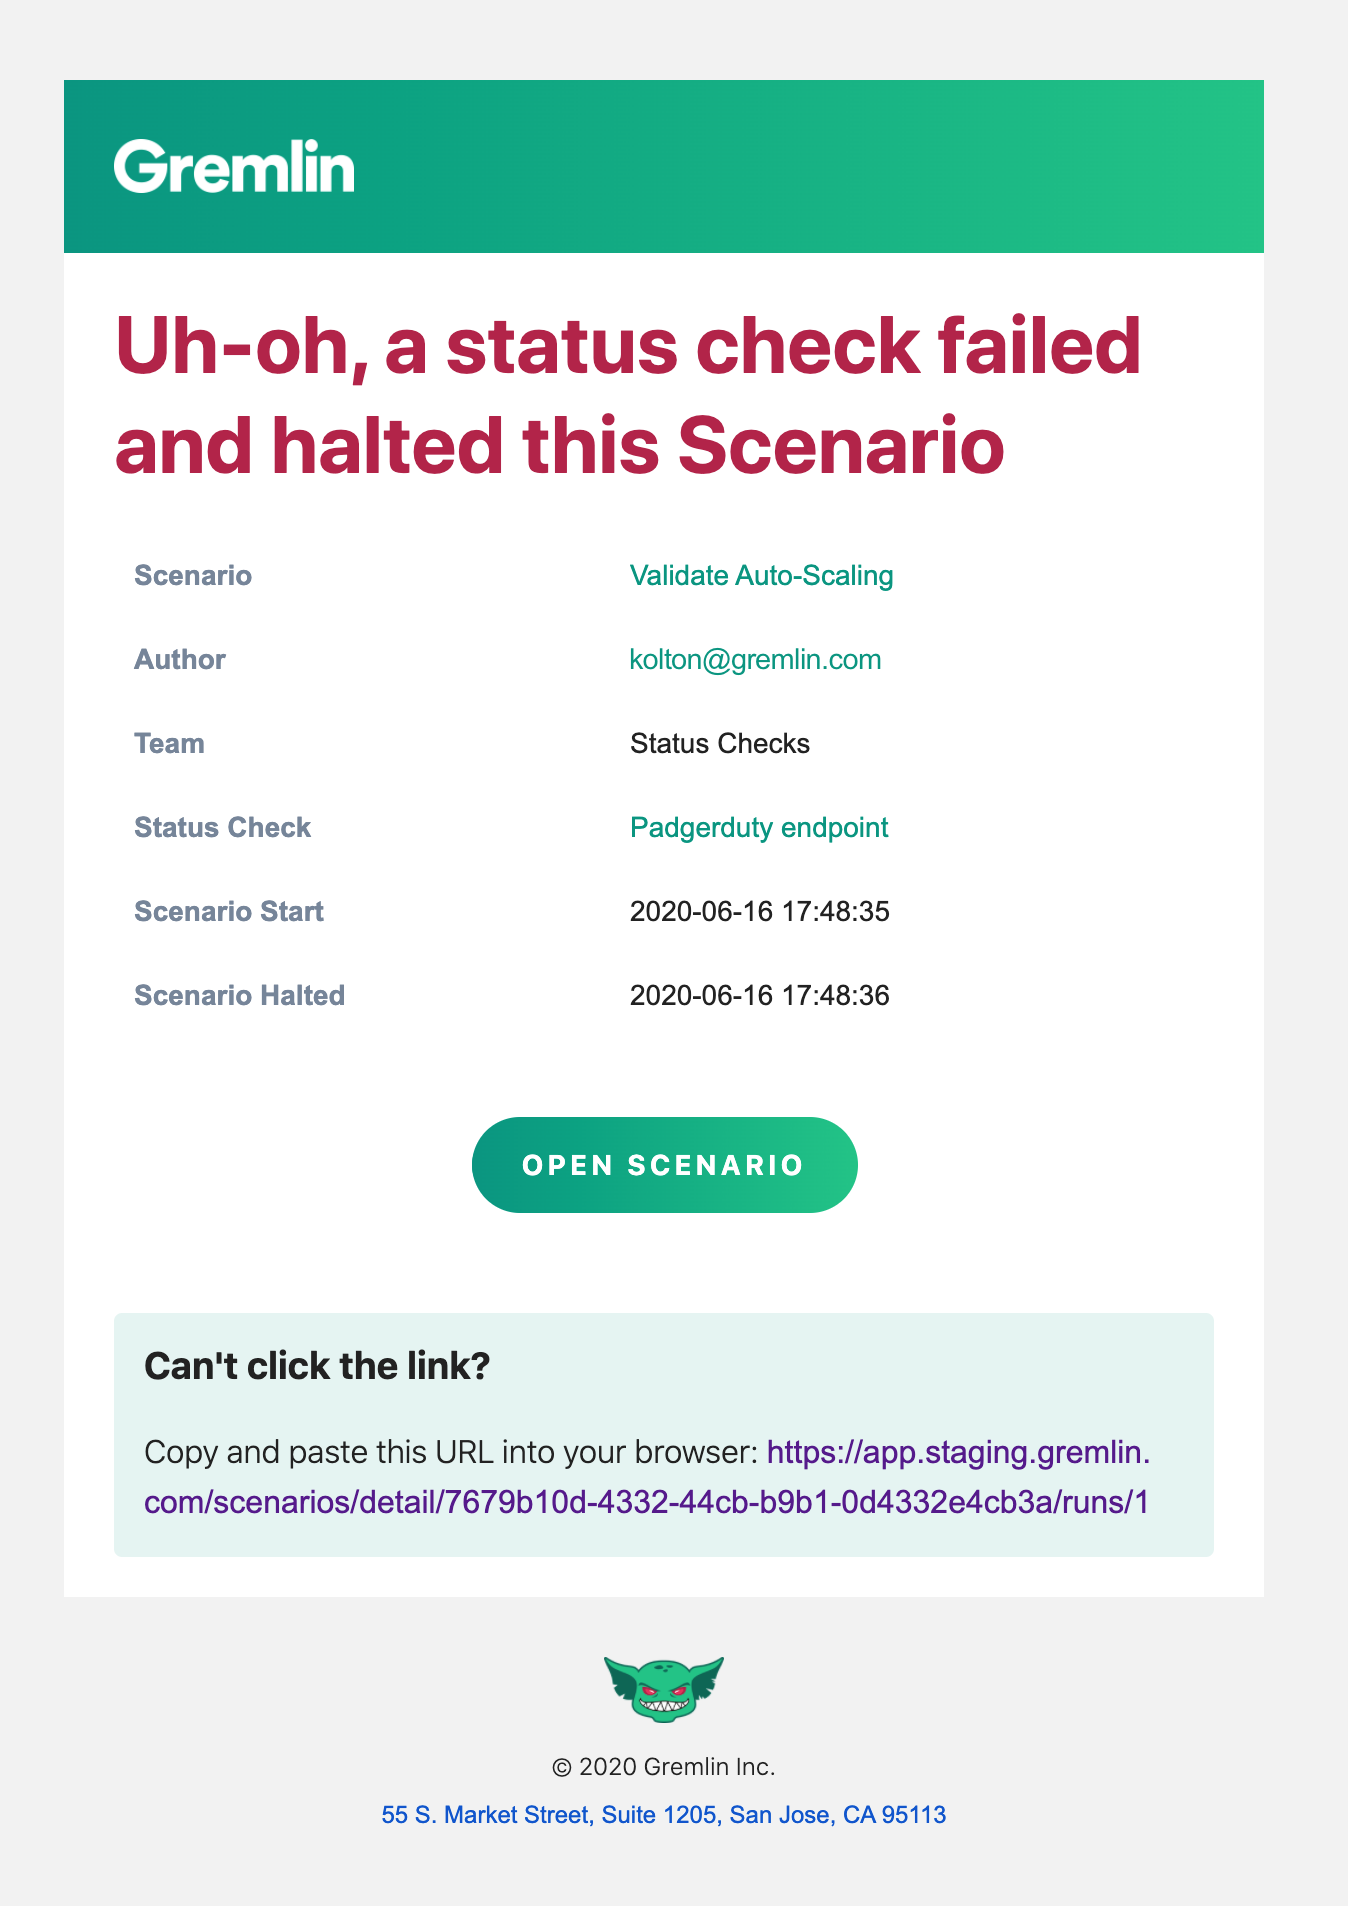
Email notifications can be configured for Scheduled Scenarios with Status Checks as long as you have the Team Manager role. If a Status Check fails the Scenario will be halted and an email will be sent either to the Scenario Author or the entire Team. Navigate to "Team Settings" and click on "Notifications" to enable or disable these options. Email notifications are disabled by default.
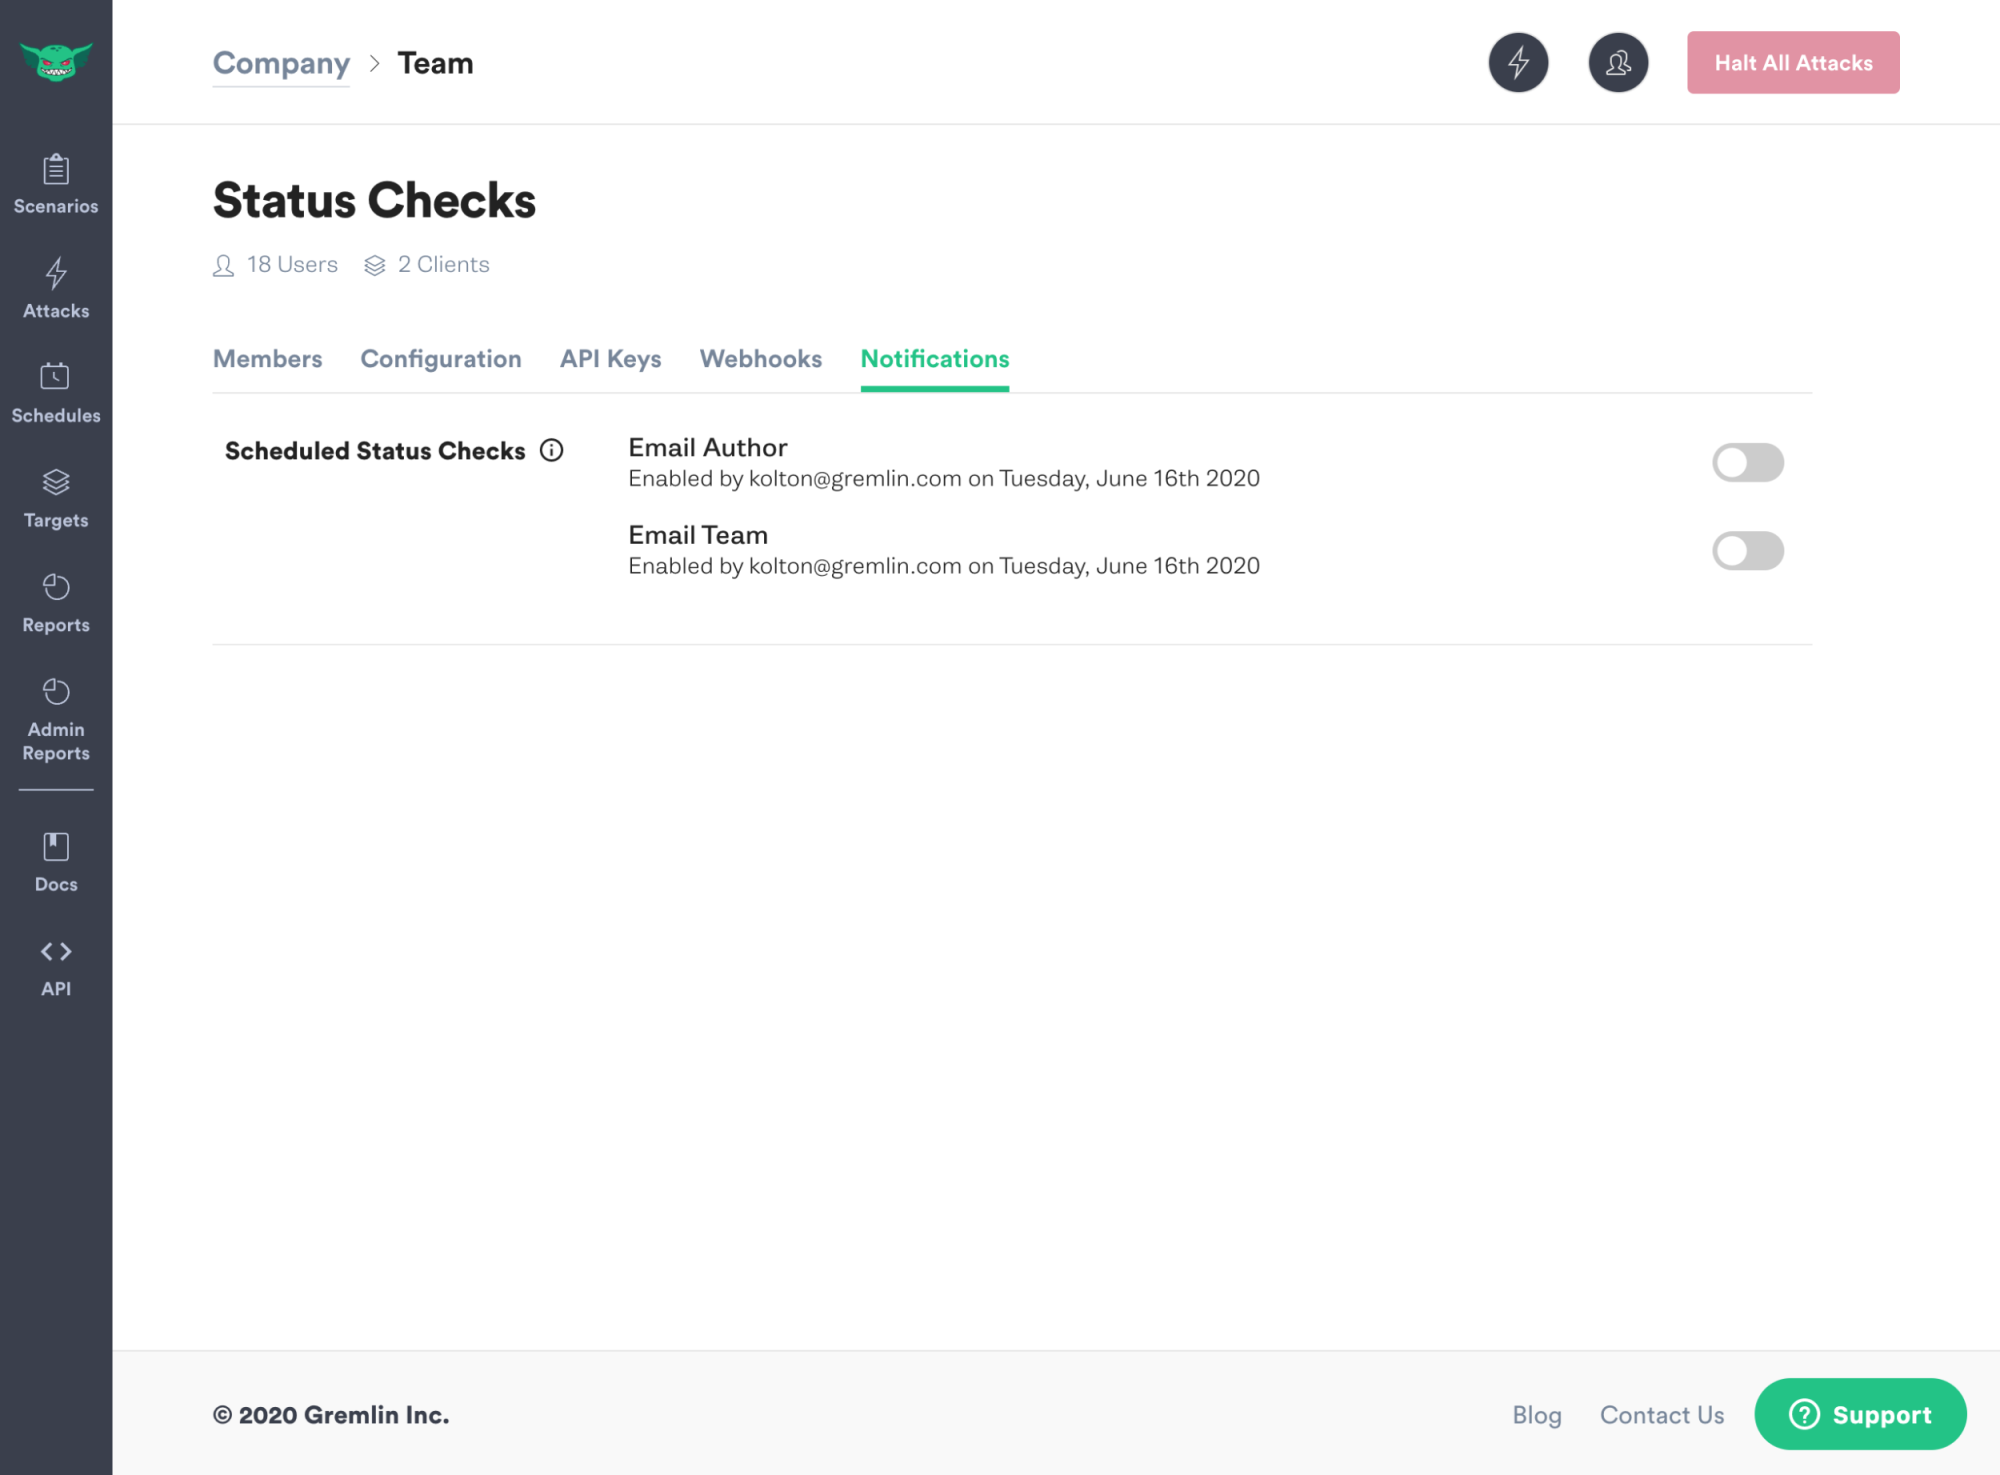
Email example for a halted Scenario due to a failed Status Check.
Status Checks IP Ranges
If your firewall is blocking the utilization of the Status Check feature you will need to add the following AWS us-west-2 EC2 CIDR range to your allow list.
154.148.0.0/15299.77.130.0/24315.193.7.0/24418.236.0.0/15554.200.0.0/15664.252.72.0/24752.94.249.64/28870.224.192.0/18954.245.0.0/161099.77.152.0/241135.160.0.0/131254.68.0.0/141354.212.0.0/151452.95.230.0/241599.77.253.0/241652.12.0.0/151752.75.0.0/161854.218.0.0/161954.244.0.0/162044.224.0.0/112164.252.73.0/242252.95.255.112/2823100.20.0.0/142454.214.0.0/162534.208.0.0/122652.36.0.0/142754.202.0.0/152852.95.247.0/242950.112.0.0/163052.94.116.0/223164.252.119.0/243252.46.180.0/223352.24.0.0/143464.252.65.0/243518.246.0.0/163652.88.0.0/153715.177.80.0/243815.254.0.0/163952.40.0.0/144064.252.70.0/244152.32.0.0/144254.184.0.0/134364.252.71.0/244435.155.0.0/164552.10.0.0/154652.94.248.96/284799.77.186.0/24