It started at the interview
“How do you measure availability?”
That was an interview question I had while applying for a Technical Program Manager position at a company who had a huge online presence.
I didn’t have a direct answer for him. At least not immediately. The question, to me, was too broad and vague. Availability of what? Of a service? Of the whole website? Are we talking in minutes? Or maybe in the number of 9’s over a period of a year? I explained my confusion and my hesitation to the interviewer (essentially a Director of Platform Services).
“It’s ok, we don’t know either”, the Director explained.
Apparently, the company’s leadership had just gone through an exercise to attempt to define metrics that could help predict the health of their website. Their initial measurement was very binary: “Broken” or “not broken”. The results of their initial meeting were questionable, at best. Everyone came out of it with a different set of metrics and indicators that they deemed “important”, and there is where the discontinuity began.
Over time, the company’s executive leadership narrowed down all their metrics to a dozen “Official” performance indicators. Their next step was to get everyone to rally around these “Golden Metrics” for the company. To do that, each service owner needed to understand the high level messages around “What”, “Why”, and “How” the Engineering and Operations teams should move forward.
Sharing the Message (or Issuing the Directive)
The company’s leadership encountered several “excuses” for not prioritizing the new initiative.
- “I already have dashboards.”
- “I don’t have time to make these.”
- “My services are Tier-3 services.”
Each team had their own priorities, and leadership understood that there was some effort needed to get these tasks nominated out of the backlog. It was obvious to everyone, though, that there would be a distinct advantage to having these dashboards available.
What is all this for?
Pro Tip: Leaders are paid to make decisions, and make them fast. In order to make those decisions, leadership relies on their teams to provide them with the most accurate and useful information in the shortest amount of time. Service/Business metrics dashboards effectively help illustrate and communicate that information. For those teams that were not onboard with building out dashboards for themselves, they recognized they could help their leadership understand their services’ landscape better.
Why should we have metrics?
If you do not know about your issues, there will be no effort to resolve them. There is an adage often cited:
What gets measured gets fixed.
Without visibility into your service’s health, you and your leadership should have zero confidence in the overall availability of your services. When you measure aspects of your service, you can understand them, discuss them, and act upon them with confidence.
Why should we have a dashboard?
Dashboards are particularly useful from a management and operational perspective. Quickly glancing at a few key performance indicators is a much more efficient use of time than having to constantly dig into deep-linked graphs and metrics.
Defining the environment
Your service’s environment consists of the service itself, its direct and indirect customers (its “neighbors"), as well as the services you rely and depend on (your “neighbors”).
Understanding your service
You (and your team) are the stewards for your services. Nobody should know the intricacies of your services better than you. With that being said, you also know who your direct customers are (generally these are your upstream services or users). If your service begins experiencing issues, what is your customer’s experience? What event or issue would they approach your team about? Maybe they are receiving errors in their logs that are not being handled. Or their systems are timing out because your services are taking too long to respond. At a high level, someone is experiencing x because your service is doing y. Consider exposing and monitoring metrics for y.

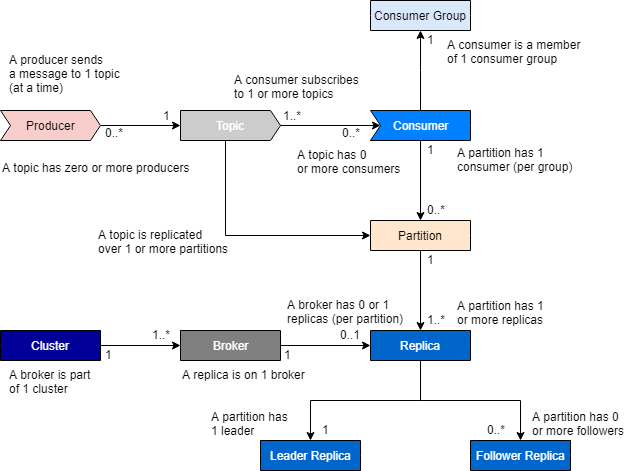
Image 1: Even within particular services such as Kafka, there are customer and provider relationships.
Understanding your customers and their neighbors
Keep in mind that depending on how deep in the stack your service lives, your customers are likely to have customers of their own. Perhaps your direct customers are oblivious to a set of errors being passed up from your service, but those errors are being bubbled up to your customers’ customers, and their customer’s customers. Take the time to understand how failure within your own service can exhibit impact at multiple levels.
Understanding your neighbors
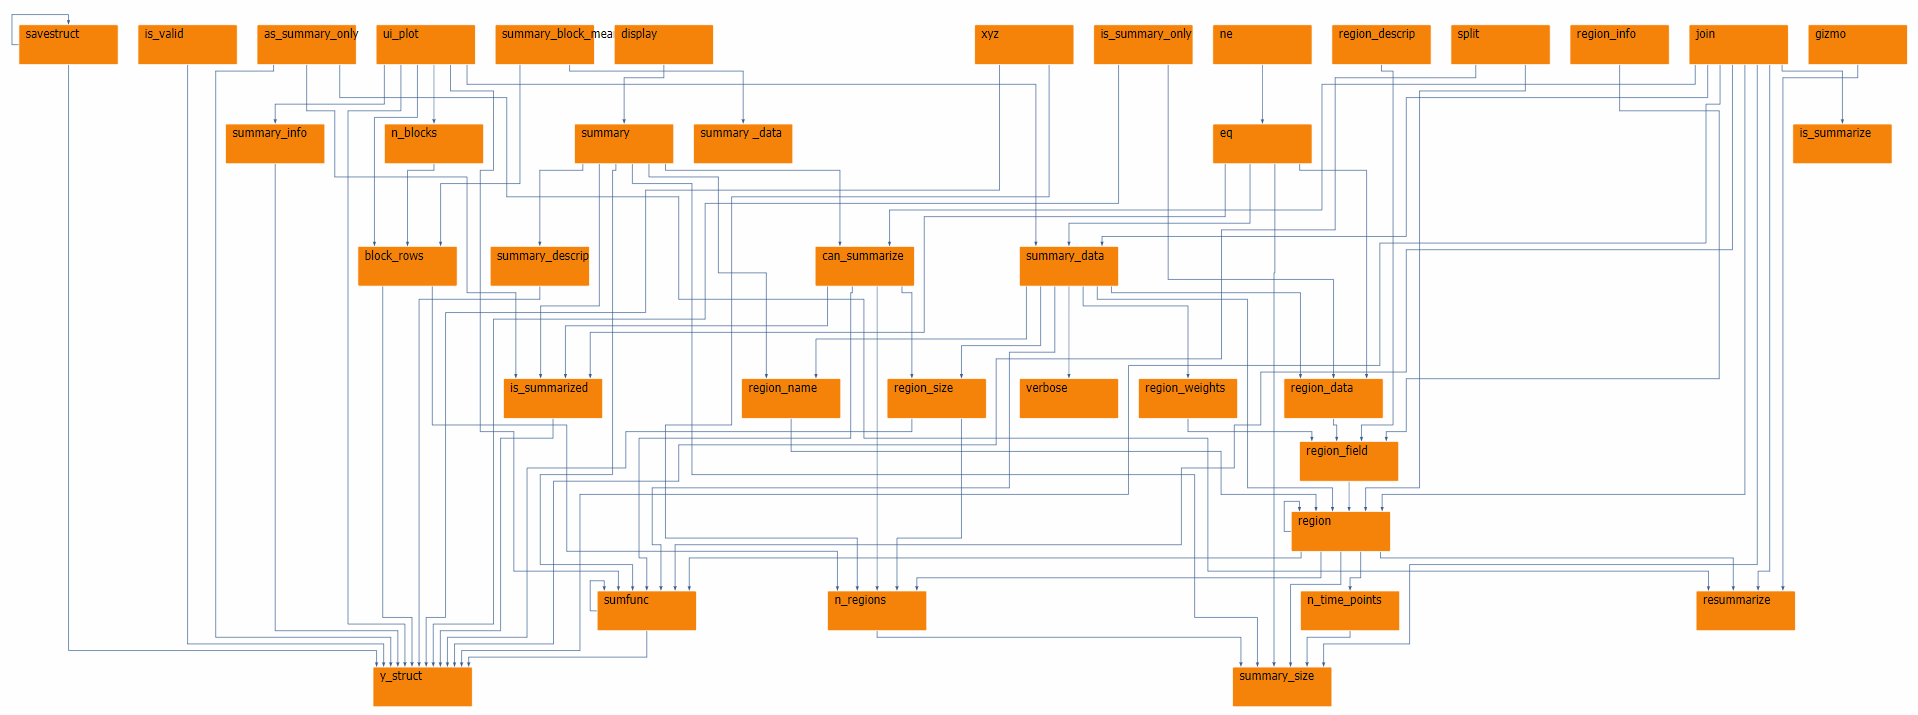
As we begin to analyze how the upstream systems function (or fail) when there are issues with your service, it is important to also validate how our own services function when the upstream/downstream dependencies are in an abnormal state. Perhaps your upstream service makes a call, but then disappears before you can send a response. Or some added latency from multiple downstream services has bubbled up to your service. Our interconnected services often resemble a plate of cooked spaghetti, so it is crucial that we can trace the path of a request both to and from our services.

Image 2: Mapping dependencies can potentially be a daunting task, but is critical to properly knowing your environment.
Measuring Your Baseline
After gathering all these metrics, we should ensure that we have an adequate baseline for our metrics to be compared against. Depending on the service(s), sometimes a week’s worth of data is sufficient. Other times, we try to gather a year’s worth to be able to compare year over year differences. Whatever the initial time frame, the first window should always gather as much detail as possible. If we discover that a particular metric is not as useful as we had originally believed, it is easy to exclude it for the next time around. Conversely, adding metrics can be much more challenging and could end up costing more time if we have to redo/re-measure because we missed it the first time around.
Analyze Your Findings
So we have all of this data - what now? Our next milestone is to determine and set achievable and repeatable milestones based on our historical compilation. Work with your teams and customers to set attainable and reportable goals. At this stage, regularly share, review, and report on these metrics to ensure acceptable levels of performance and availability are being met.
Definitions
To make things a little easier to correlate, we should define some common terminology.
Service Level Metrics
These are metrics that are particular to the health of a service. More often than not, performance and reliability metrics for services will begin with an error rate and latency metric to measure themselves against.
Error
A non-successful or abnormal result of a system call or a series of system calls.
Error Rate
A measurement of errors over a specified time window. Depending on the service and the type of reporting needs, most graphs choose to define a unit of time to range anywhere from seconds to hours.
Latency
Internal to the service, this could be the amount of time it takes for the service to complete the request. External to the service, this measurement could represent the time it takes to receive a response from its dependencies.
Business Level Metrics
A Key Performance Indicator (KPI) that directly influences the bottom line of the company. For some e-commerce companies, for instance, it could be “$/Hr”, video streaming sites might choose to measure “streams started/minute”. Whatever the metric, if we can trace an end-user usage metric to your service, then we have uncovered a potential business level metric that we should elect to prioritize and monitor.
Service Level Indicator (SLI)
A metric/value/measurement that will be used to define the Service Level Objective (SLO). Examples such as throughput, latency, availability, and capacity are very common indicators that can represent the health of a service.
Service Level Objective (SLO)
This is a target/goal for our system’s availability over time. These goals must be attainable, measurable, and meaningful to your service and your business. Some examples include:
- The service will be available 99.95% over one calendar year
- 98% of Sev-1 incidents will be acknowledged within 5 minutes
- 99.5% of all customers will successfully checkout without errors
Service Level Agreement (SLA)
This is an agreement between your service and its direct customers that defines the service and responsiveness they can expect, and how the performance will be measured and reported. Simply put, an SLA is a promise to your customers that you will maintain your SLOs. The goal of such an agreement within the same company is to allow teams (customers) to have the right expectations about the availability of the services they rely on (service providers).
Improve and Control
As reporting and reviews become more regular, areas of improvement will become apparent. Defining, measuring, and analyzing those areas of improvement with a systematic approach will help provide a reliable and gradual resolution. The process will naturally introduce incremental improvements, and controls (such as technology, automation, other processes, etc) can be put in place to maintain the developing standards.


